Monitoring Test automation: Gathering metrics — Part 1
Using Prometheus to gather metrics and visualizing it in Grafana

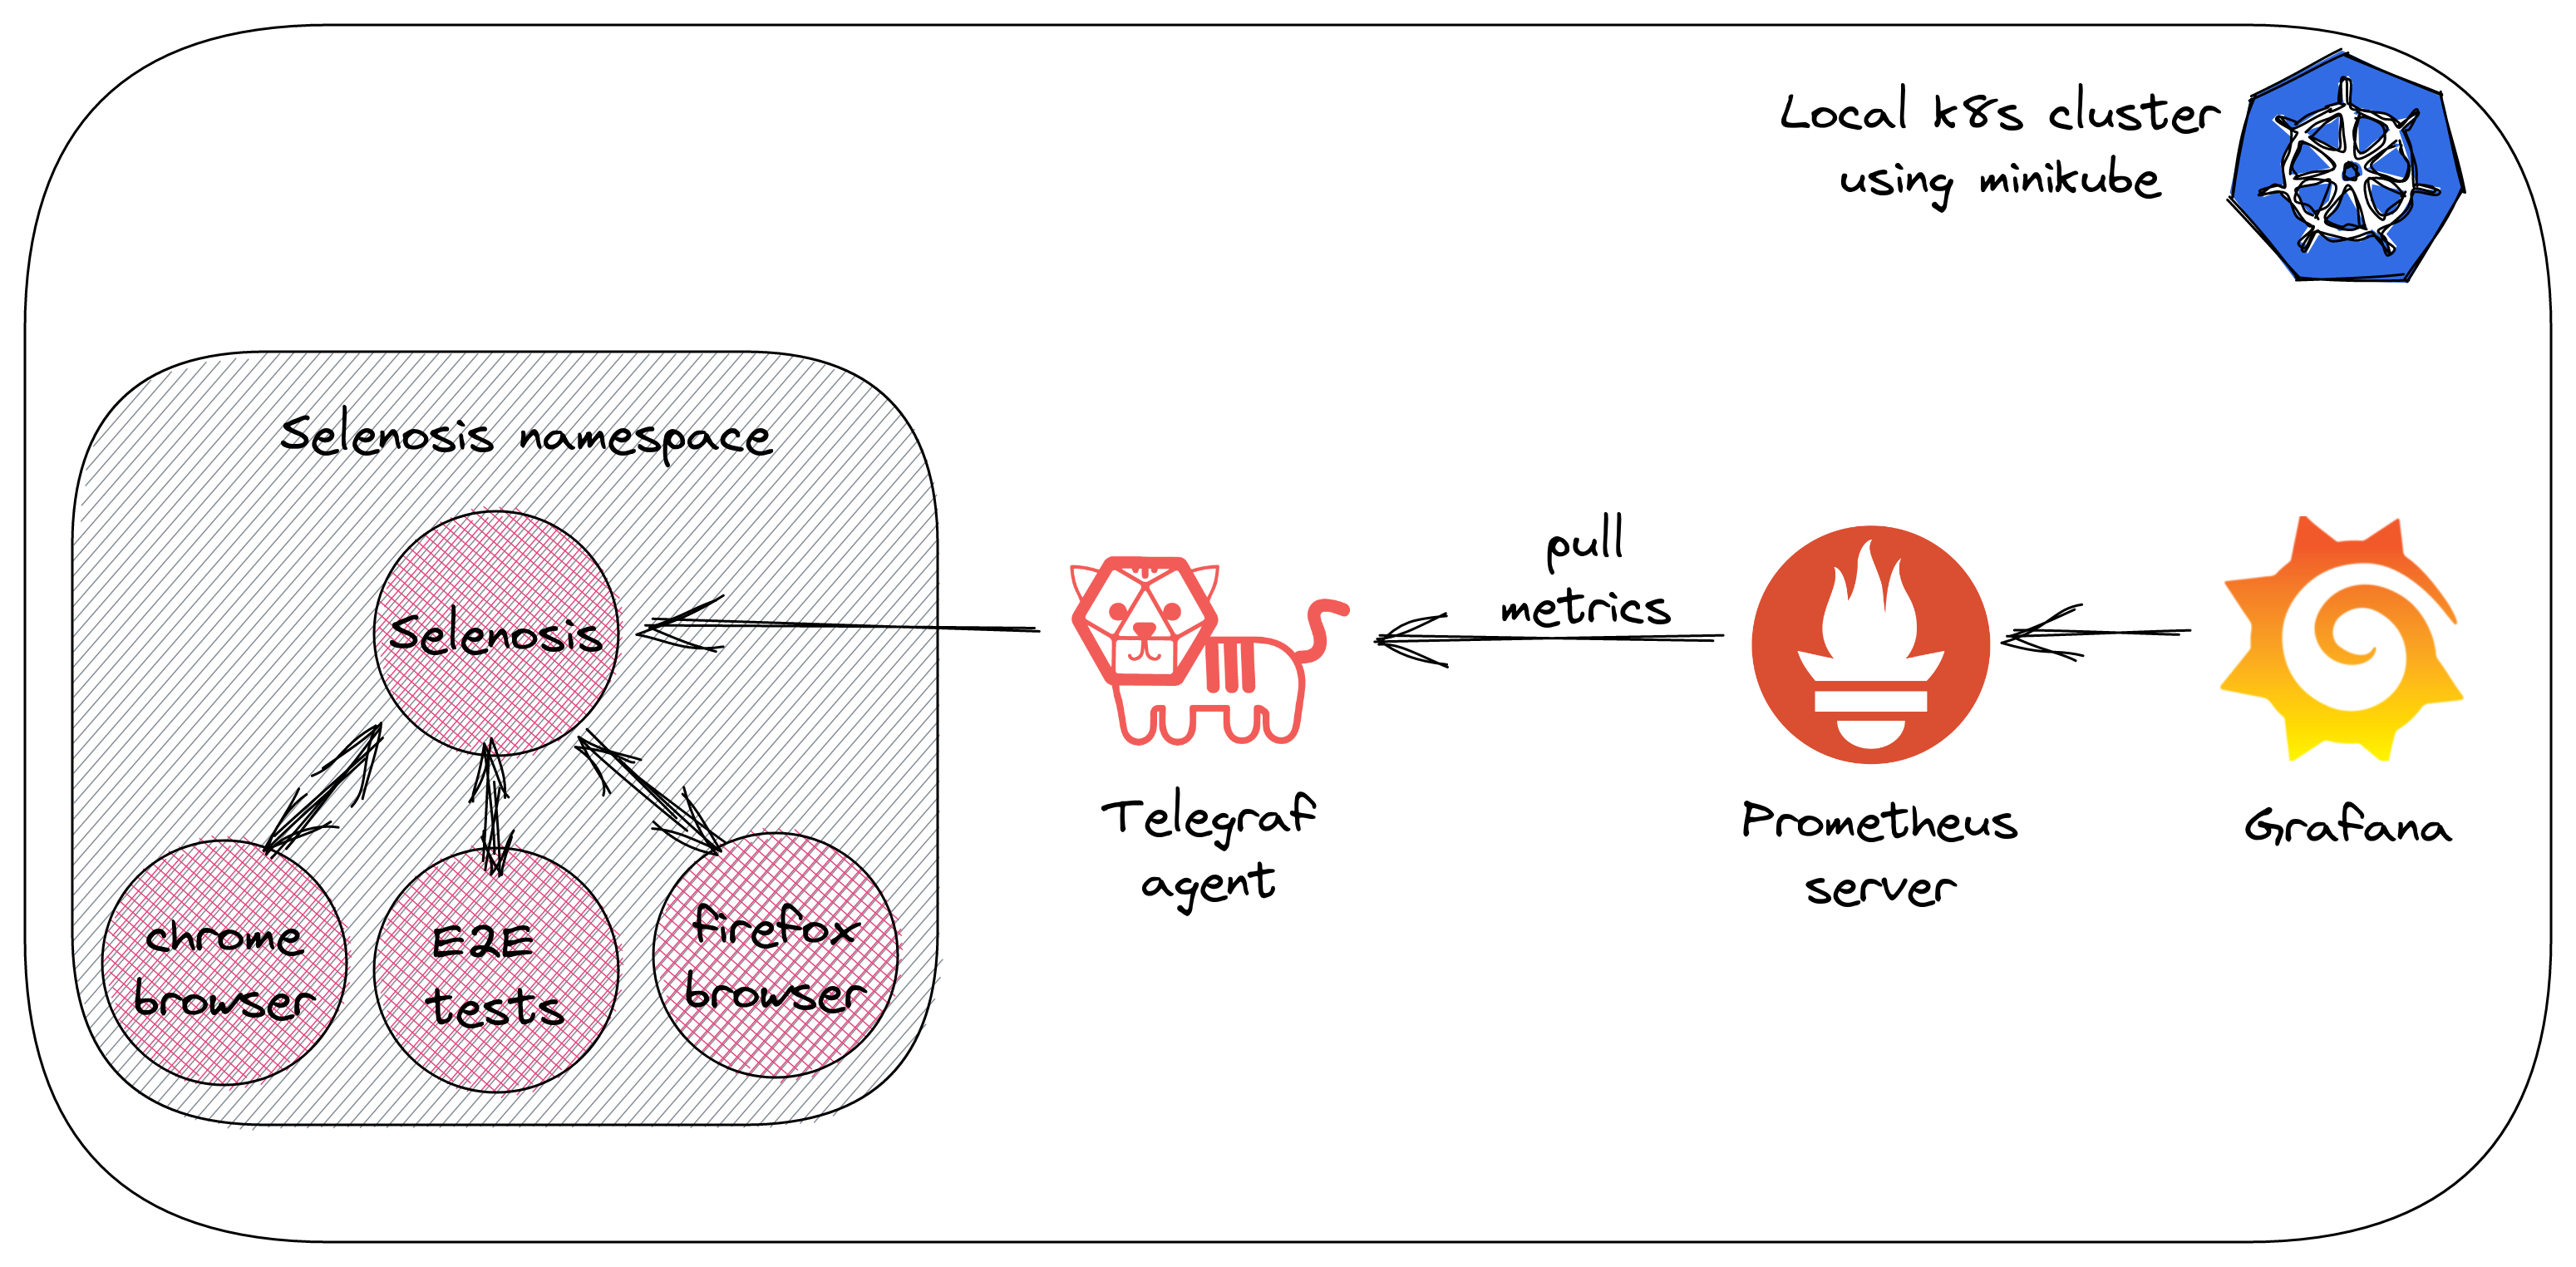
In this article we are going to see how to add a monitoring capability to my previous work Scaling tests on Kubernetes. We will use Telegraf to transform selenosis metrics, Prometheus to collect metrics and visualize it using Grafana.
-
Prometheus is an open-source systems monitoring and alerting toolkit, stores its metrics as time series data in Time series Database (TSDB)
-
Telegraf is an open-source agent for collecting, processing, aggregating, and writing metrics
-
Grafana is an open-source data-visualization platform
Monitoring Setup

To follow along with this article, do checkout the source code and use minikube or kind or any self-hosted/managed k8s cluster.
Install Prometheus to collect metrics
Recommended way of installing Prometheus in k8s cluster is using helm charts.
helm repo add prometheus-community https://prometheus-community.github.io/helm-charts

helm repo update

helm install prometheus prometheus-community/kube-prometheus-stack --values infra/prometheus/values.yml
Once the deployments are successful, port forward to access the Prometheus UI on the browser at http://localhost:9090
kubectl port-forward service/prometheus-kube-prometheus-prometheus 9090:9090
Setup Selenosis test infrastructure
Please refer to the detailed instructions of setting up test infrastructure in this article. In short, execute the shell script sh infra/selenosis/script.sh from the root folder to complete the test infra setup.
Once the script has been successfully executed and pods are up & running, port forward to see the selenosis status at http://localhost:4000/status, usage of selenosis metrics is available in JSON format.
kubectl port-forward service/selenosis 4000:4444 -n selenosis
Converting to Prometheus understandable metrics
Since Selenosis is a 3rd party application and doesn’t have /metrics endpoint exposed to scrape metrics. And also, Prometheus doesn’t understand metrics that are in JSON format, so we will use Telegraf plugins to convert JSON into Prometheus understandable data format.
And also there are a number of libraries and servers which help in exporting existing metrics from third-party systems as Prometheus metrics.

[[inputs.http]]
urls = ["http://selenosis:4444/status"]
data_format = "json"

[[outputs.prometheus_client]]
path = "/metrics"
listen = ":9273"
Execute the below commands to apply manifests files of telegraf to setup it up in k8s cluster.
kubectl apply -f infra/telegraf/
Now apply the following k8s manifest file so that Prometheus operator can pick up telegraf service monitor _and add it to the scraping targets. _(Basically, operator takes cares most of creation/deletion/reload config of k8s app lifecycle, for more info refer here)
kubectl apply -f infra/prometheus/telegraf-svc-monitor.yml
Querying Prometheus metrics using PromQL
Prometheus offers the PromQL, using which we can select and aggregate time series data in real time.

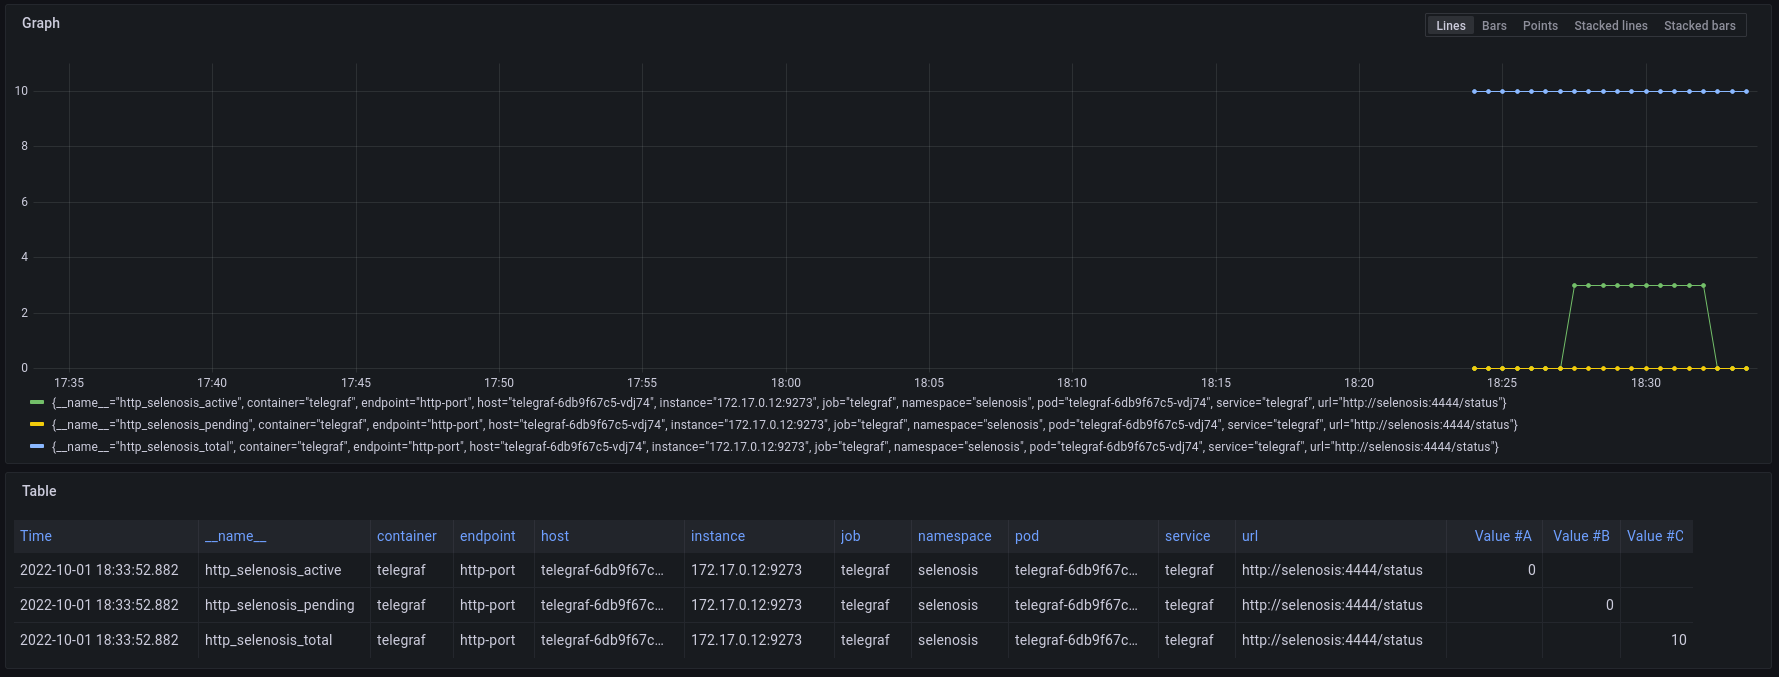
Selenosis exposes http_selenosis_active , http_selenosis_pending , http_selenosis_total and these metrics are of gauge type (in which metrics can go up and down). And Prometheus supports four types of metrics in total.
Start executing the tests to see selenosis metrics usage in prometheus by executing the following command in the terminal.
kubectl apply -f e2e-test.yml
Visualizing metrics in Grafana
Grafana comes as part of the Prometheus helm installation, no additional setup is required and also it supports the PromQL out of the box. To access the Grafana UI, port forward the incoming request and access it on the browser at http://localhost:3000/status
kubectl port-forward deployment/prometheus-grafana 3000:3000

From the above dashboard we track the usage metrics of Selenosis. When it started pending-0 , active-0 & total-10 remains the same and as soon as the test started executing active count increased to 3. Since no. of parallel execution is set to 3 in the testing framework. Once the tests are completed, the active count drops to zero.
This article shows a simple use-case of collecting and visualizing of Selenosis usage metrics. Kube state metric comes as part of the Prometheus helm installation and it currently supports about 35+ resources. So, start building your dashboards in Grafana.
Originally published on Medium
🌟 🌟 🌟 The source code for this blog post can be found here 🌟🌟🌟
References:
[1] TechWorld with Nana — Prometheus series Part 1 Part 2
[2] https://prometheus.io/docs/introduction/overview/
[3] https://docs.influxdata.com/telegraf/v1.23/
[5] https://prometheus-operator.dev/
[6] https://aerokube.com/selenoid/latest/#_advanced_features